

The physical oil market is under genuine strain right now. Yet the futures curve still carries one important assumption: some of that strain is expected to ease.
Which is why “will Brent break $100?” is not really the most useful question. What matters more is whether the market still treats this disruption as temporary, or whether long-dated contracts are starting to reprice as though the scarcity could last.
The strange part of the Brent curve
Around 21 August 2026, the Brent curve looked like this:
- Prompt Brent: roughly $94.39/bbl
- December 2026: roughly $89/bbl
- March 2027: roughly $84/bbl
- June 2027: roughly $81/bbl
This structure is called backwardation: near-dated contracts trade above contracts with more distant delivery dates. It means a barrel available now is valued more highly than a barrel that only becomes available later.
What to avoid is reading this as a forecast that Brent will fall to $81 by June 2027. Futures prices are also shaped by inventory economics, funding costs, convenience yield, hedging demand, and risk premia.
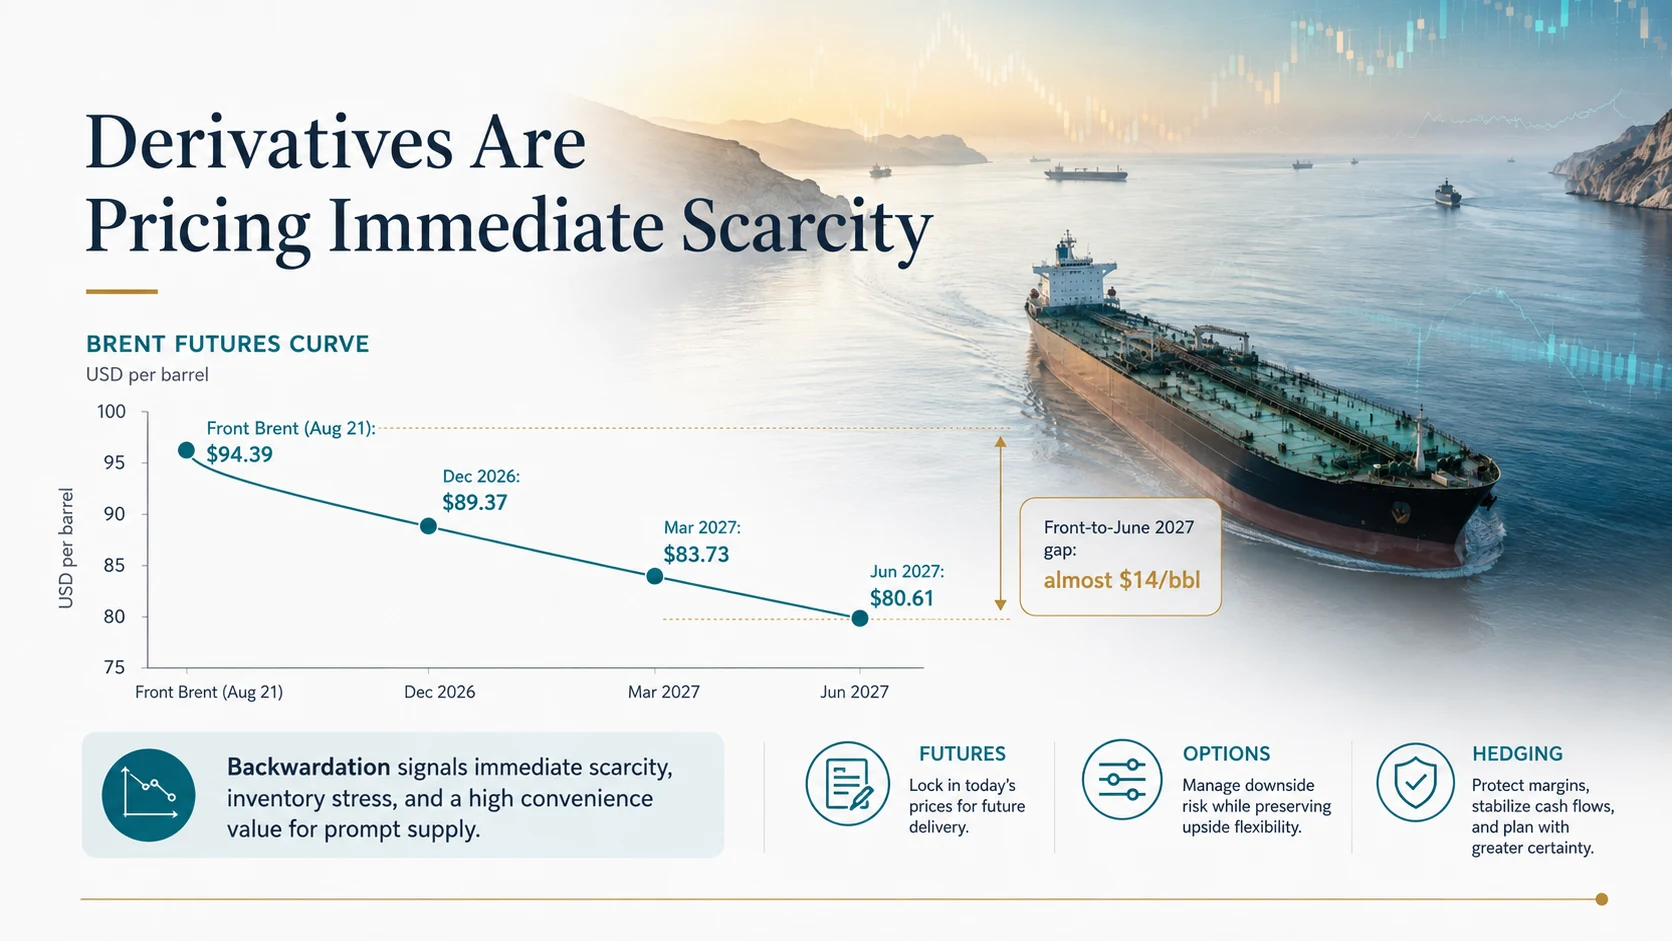
The curve is better read as the market’s way of pricing scarcity across time.
Why oil today has become more valuable
The pressure in the physical market is not just sentiment. Market data from August 2026 shows the following:
- Observed global oil inventories fell by roughly 410 million barrels through the end of July compared with when the war began.
- Global refinery throughput in July was nearly 5 million barrels per day lower than the previous year.
- Hormuz normally carries around 20 million barrels per day of oil and refined products.
- Through March–May, flows through Hormuz averaged only around 2.7 million barrels per day.
- The IEA authorised an emergency reserve release of 400 million barrels, a record.
Oil scarcity is not only about how much crude exists in the world. The market needs crude available in the right place, at the right time, with the transport, insurance, storage, and refining capacity to go with it.
Inventory acts as a buffer when production or transport is disrupted. When that buffer thins, a barrel you can actually take delivery of today becomes far more valuable. That is what explains the large premium at the front of the Brent curve.
Hormuz is not simply open or closed
The Strait of Hormuz does not need to close completely to put the oil market under pressure. The pressure can arrive through subtler channels:
- reduced tanker traffic,
- higher war-risk insurance premiums,
- rising freight costs,
- shipowners refusing voyages,
- sanctions risk and legal risk,
- military clearance requirements,
- limited alternative export routes.
Toward the end of August, some oil began transiting Hormuz again, but volumes remained far below normal.
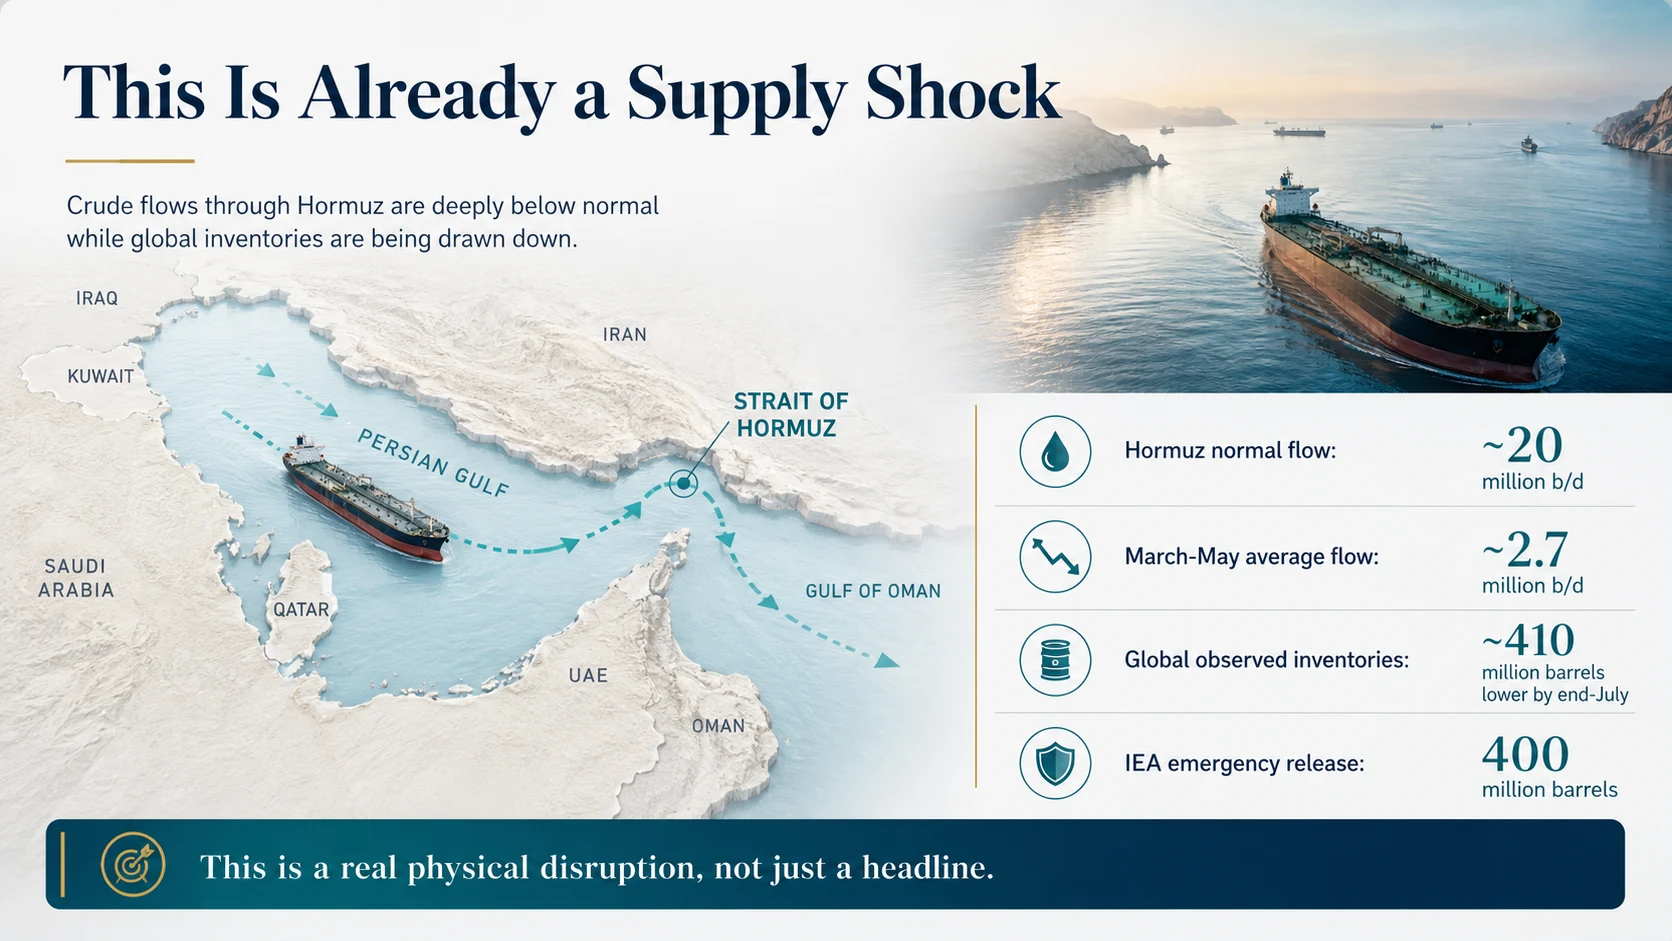
The physical supply may well still exist, while the process of delivering it becomes far harder and far more expensive.
Producers may still hold the crude. But the cost and risk of moving that crude to global consumers can create large regional price differences and keep energy prices elevated.
The bigger problem may be in refined products
Crude gets the headlines, but it is refined products that transmit this shock directly into the economy.
- US diesel refining margins briefly ran above $100 per barrel.
- US distillate inventories sat roughly 13% below the five-year seasonal average.
- European gasoil margins reached extreme levels.
- Global refinery throughput remained unusually weak.
A country can hold adequate crude inventories and still experience shortages of diesel, gasoline, jet fuel, or petrochemical feedstock.
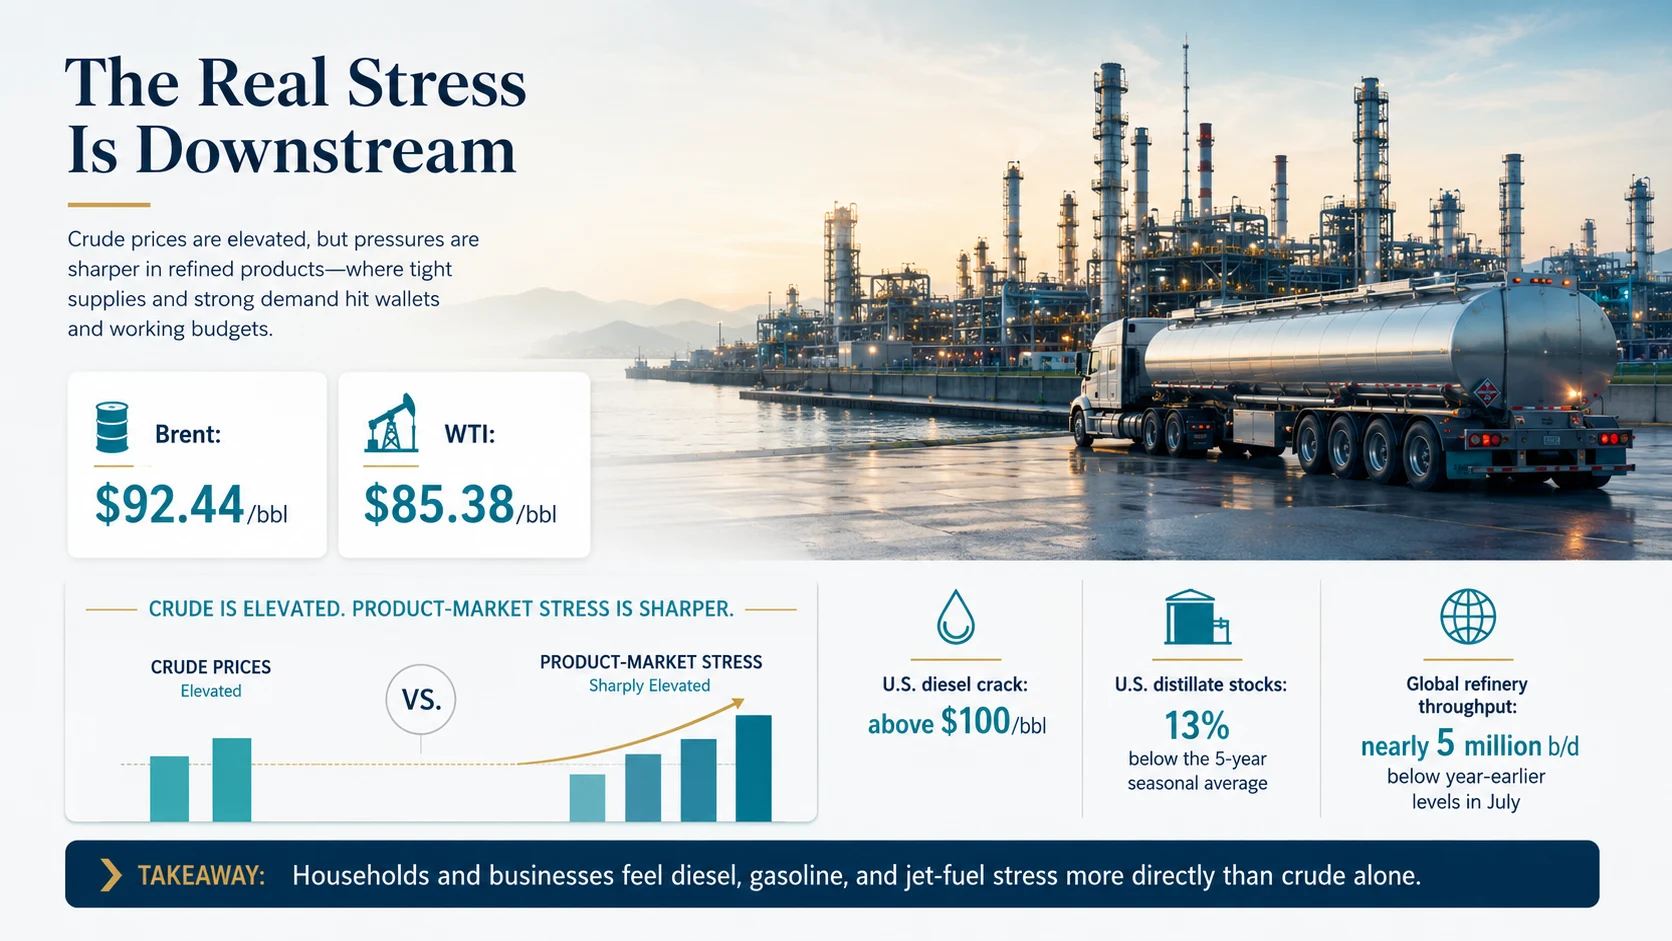
Because refined products feed straight into trucking, agriculture, mining, construction, logistics, aviation, industrial production, and household fuel bills, energy inflation can stay heavy even if Brent stops rising.
Why 2027 contracts are still cheaper
The back end of the Brent curve still embeds an assumption that normalisation arrives in some form:
- safer transits through Hormuz,
- falling war-risk insurance,
- declining tanker freight costs,
- inventories rebuilding,
- refinery throughput recovering,
- additional supply from non-Gulf producers,
- demand destruction caused by high prices,
- geopolitical de-escalation.
So the market is pricing two things at once: the physical market is tight now, and this disruption is not expected to stay this severe forever.
It is the second assumption that needs testing over time.
What could make the market reprice
Rather than asking whether Brent will touch $100, the stronger question is: what could push the entire curve higher?
Prolonged physical disruption. If Hormuz stays constrained for longer, inventories can keep draining.
Continued inventory withdrawal. Emergency reserve releases buy time, but they cannot permanently replace lost production or transport capacity.
Refining problems that never quite resolve. Even if crude availability improves, shortages of diesel, gasoline, or jet fuel can keep the energy system under strain.
Long-dated Brent starting to rise. This is one of the most important signals. If prompt Brent rises while 2027 contracts stay much lower, the market still regards the disruption as temporary. But if both ends of the curve rise sharply together — say prompt at $105, December 2026 at $102, June 2027 at $98 — the market may be starting to price long-lived scarcity.
What genuine normalisation looks like
A falling Brent price alone is not enough to confirm the physical problem is resolving. Convincing normalisation usually shows up as several indicators improving at once:
- rising Hormuz traffic flows,
- falling tanker insurance costs,
- easing freight rates,
- stabilising inventories,
- strengthening refinery throughput,
- narrowing diesel and gasoil crack spreads,
- backwardation that is no longer extreme.
When those indicators move together, the market has far stronger evidence that short-term scarcity is easing.
Futures are not a price forecast
Futures prices contain more than an expectation of the future spot price. Inside them sit expectations of supply and demand, inventories, storage economics, funding costs, convenience yield, hedging pressure, and risk premia.
So the useful question is not “does the market believe Brent will be exactly $81 in June 2027?” It is “why is the market willing to pay that large a premium for oil delivered now rather than oil delivered later?”
The second question takes us back to physical scarcity and the value of supply available on the spot.
How derivatives transmit an oil shock into the financial system
The oil market does not sit apart from the financial system. Producers, refiners, airlines, commodity merchants, industrial companies, and financial institutions all use futures, swaps, and options to hedge.
When prices move sharply:
- futures positions generate variation margin,
- companies need additional cash collateral,
- commodity traders draw on credit facilities,
- leveraged investors sell liquid assets to raise cash.
This is where the crucial distinction between solvency and liquidity appears. A company can be economically hedged against rising oil prices and still face a short-term liquidity problem if its derivatives demand cash collateral now while the offsetting physical cash flow only arrives later.
When an oil crisis becomes a financial crisis
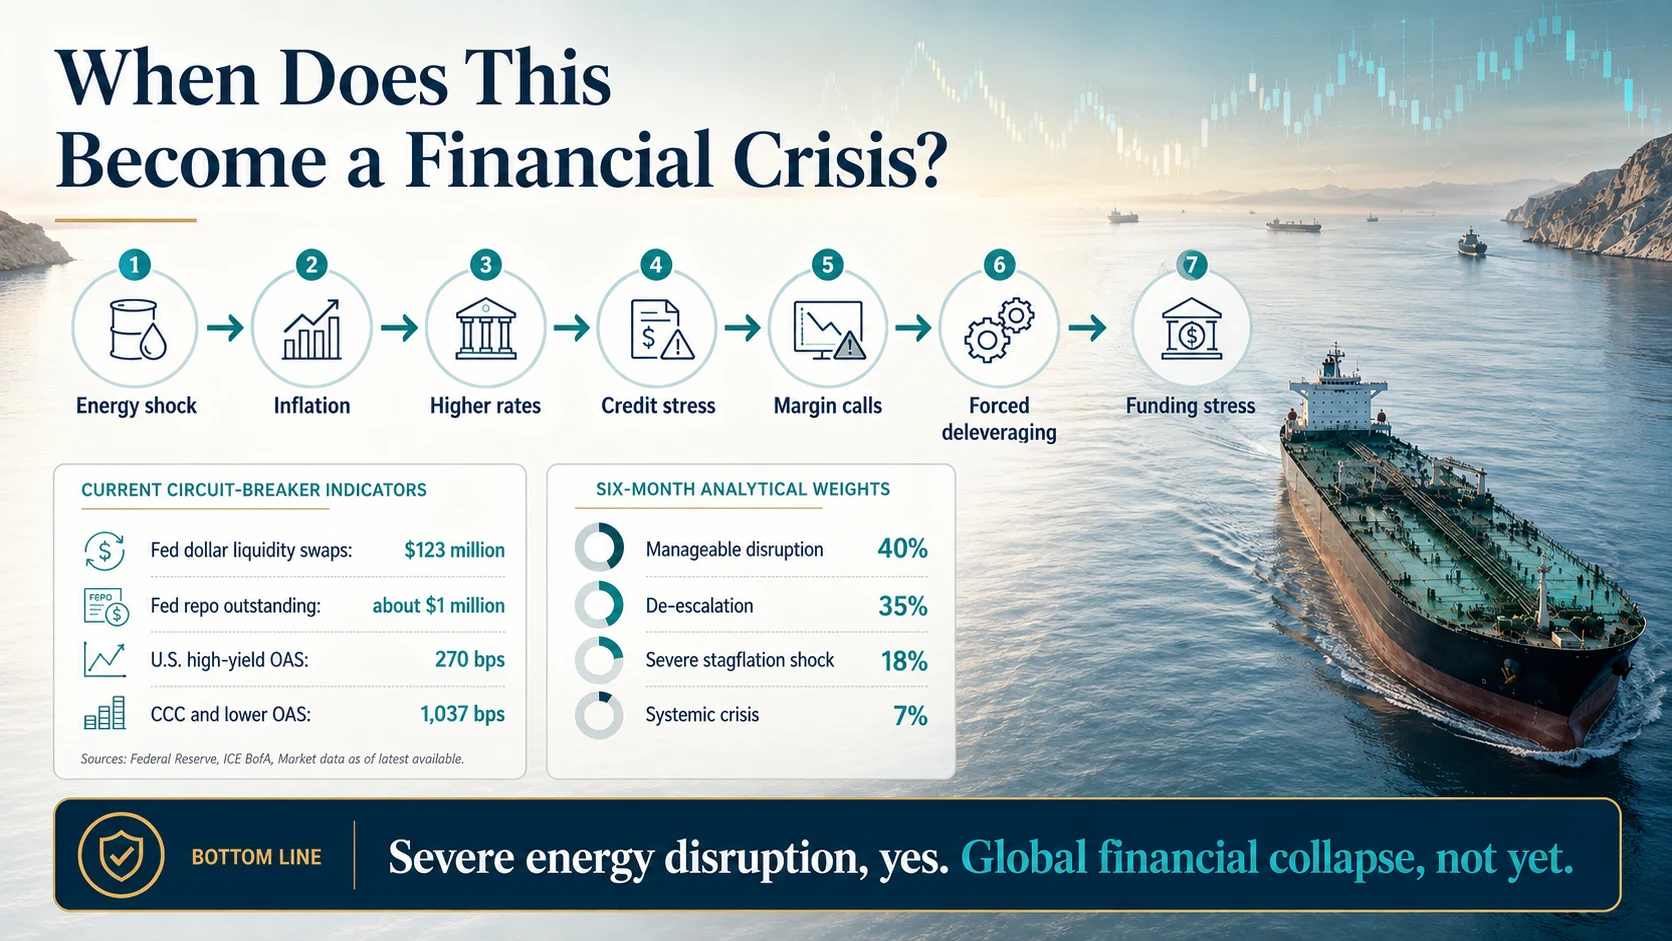
The transmission chain runs broadly like this: oil supply disruption → energy inflation → central banks stay restrictive → bond yields stay high → refinancing gets more expensive → credit quality weakens → derivative collateral needs rise → institutions need more cash → forced asset sales increase → funding markets come under strain.
So far, several indicators suggest systemic funding markets are still broadly functioning:
- Usage of the Federal Reserve’s central bank dollar swap facilities remains very small.
- US high-yield spreads have generally not reached crisis levels.
- Low-quality borrowers (CCC) are under far greater pressure, but that pressure has not spread through the whole system.
The interim conclusion: physical energy stress is already severe; financial system stress is not yet systemic.
What traders should be monitoring
A discussion about oil should not stop at a single price target. A more useful dashboard covers:
- the Brent futures curve,
- the prompt-versus-2027 Brent spread,
- global oil inventories,
- flows through Hormuz,
- tanker freight rates,
- war-risk insurance premiums,
- global refinery throughput,
- diesel and gasoil crack spreads,
- distillate inventories,
- long-dated Treasury yields,
- high-yield credit spreads,
- dollar funding conditions.
The goal is not to guess a number. It is to understand whether this physical shock is easing, persisting, or beginning to seep into financial markets.
The market is clearly pricing scarcity today while still pricing relief later. The question that remains: what if that relief keeps getting postponed?
Primary sources: International Energy Agency, “Oil Market Report – August 2026”; Intercontinental Exchange, “Brent Crude Futures”; Reuters (21 August 2026); Federal Reserve H.4.1; ICE BofA US High Yield Option-Adjusted Spread.